Using Performance Meter
Use the Performance Meter to monitor activity and performance on a workstation. Several performance parameters such as CPU utilization, disk activity, network packets, and the like, can be displayed graphically in this customizable window.
You can monitor performance of local or remote hosts, set up color-coded activity thresholds to warn you of exceptional performance, and log the samples to a file.
Tip - Performance Meter enables you to identify errant behavior on your system. After identifying the errant behavior, you can use Process Manager (see Chapter 19, Using Process Manager) to identify and kill the errant processes.
To Open Performance Meter
Click the Performance Meter control on the Font Panel.
Performance Meter opens and displays the default charts (CPU and disk activity).
Tip - To make Performance Meter's Front Panel icon inactive, use Process Manager to kill the sdtperfmeter process.
Choosing the Host and Parameters to Display
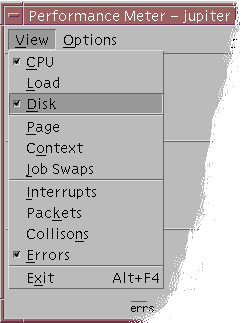
You can monitor performance on your workstation (local) or on another workstation (remote). The View menu lists several performance parameters that you can display for the host you are monitoring.

The parameters you choose to monitor may depend on:
The type of applications you run
Your network
Your level of understanding of UNIX processes and system loading
Users unfamiliar with system parameters will typically choose to display CPU and disk usage. The typical setup for a more aware user is to display the CPU usage, disk usage, system load, and packets. Here are some hints and tips for choosing what to monitor:
If you are worried about network traffic congestion, display the number of network packets per second and monitor this performance while you are running network-intensive activities such as Internet browsing or remote operations.
If Performance Meter indicates high CPU usage, use Process Manager to identify and kill errant or CPU-intensive processes.
If you log out while running a CPU intensive application, and log back in, Performance Meter's CPU display may show you that there is a lot of CPU activity. On recognizing this, you can use Process Manager to kill any errant processes.
For further information, see Managing System Performance in System Administration Guide: Advanced Administration.
 To Specify the Host to Be Monitored
Choose Setup from the Options menu.
Performance Meter displays the Setup dialog box.
Select the Remote radio button to indicate that you are about to type the name of a remote host.
Type the system name (for example, jupiter) or the IP address (for example, 129.156.220.133) of the remote host.
Tip - To find a host, use Address Manager with Hosts selected on the Find menu.
Click Apply to make your changes take effect.
Performance Meter accesses the remote host and displays its performance. The system name on the title bar of the Performance Meter main window changes to the name of the remote host.
 To Change the Parameters Displayed
Open the View menu to display the list of available parameters.
Each parameter has a checkbox to indicate whether it is currently selected for display.
Select or deselect the relevant menu item to display or remove any of the parameters.
You can display any combination of parameters.
Choosing How the Parameters Are Displayed
You can arrange the Performance Meter window in different ways, depending on the number of parameters you have chosen to display, the space available on your desktop, and whether you want to display historical values.
Figure 20-1 Performance Meter Displaying All Parameters

 To Show/Hide the Menu Bar
Choose Hide/Show Menubar from the Options menu.
Performance Meter hides the menu bar.
You can re-display the menu bar at any time by clicking once on the display area of the Performance Meter main window.
 To Show/Hide the Line Chart or Area Chart
Choose Hide/Show Strip Chart from the Options menu.
Performance Meter hides the line/area charts for all displayed parameters if they were displayed, or displays the line/area charts if they were hidden.
For each parameter you choose to display, Performance Meter displays:
An activity bar to show the instantaneous level for each parameter
(Optional) A line chart or an area chart to show the performance for each parameter over time


