Audit Interface Example
The following simple example creates an audit library that prints the name of each shared object dependency loaded by the dynamic executable date(1).
$ cat audit.c
#include        <link.h>
#include        <stdio.h>

uint_t
la_version(uint_t version)
{
        return (LAV_CURRENT);
}

uint_t
la_objopen(Link_map * lmp, Lmid_t lmid, uintptr_t * cookie)
{
        if (lmid == LM_ID_BASE)
                (void) printf("file: %s loaded\n", lmp->l_name);
        return (0);
}
$ cc -o audit.so.1 -G -K pic -z defs audit.c -lmapmalloc -lc
$ LD_AUDIT=./audit.so.1 date
file: date loaded
file: /usr/lib/libc.so.1 loaded
file: /usr/lib/libdl.so.1 loaded
file: /usr/lib/locale/en_US/en_US.so.2 loaded
Thur Aug  10 17:03:55 PST 2000
|
Audit Interface Demonstrations
A number of demonstration applications that use the rtld-audit interface are provided in the SUNWosdem package under /usr/demo/link_audit:
- sotruss
This demo provides tracing of procedure calls between the dynamic objects of a named application.
- whocalls
This demo provides a stack trace for a specified function whenever called by a named application.
- perfcnt
This demo traces the amount of time spent in each function for a named application.
- symbindrep
This demo reports all symbol bindings performed to load a named application.
sotruss(1) and whocalls(1) are also included in the SUNWtoo package. perfcnt and symbindrep are example programs only and are not intended for use in a production environment.
Audit Interface Limitations
There are some limitations regarding the use of the la_pltexit() family. These limitations stem from the need to insert an extra stack frame between the caller and callee to provide a means of acquiring the la_pltexit() return value. This requirement is not a problem when calling just the la_pltenter() routines, as any intervening stack can be cleaned up prior to transferring control to the destination function.
Because of these limitations, la_pltexit() should be considered an experimental interface. When in doubt, avoid the use of the la_pltexit() routines.
Functions That Directly Inspect the Stack
A small number of functions exist that directly inspect the stack or make assumptions regarding its state. Some examples of these functions are the setjmp(3C) family, vfork(2), and any function that returns a structure, not a pointer to a structure. These functions will be compromised by the extra stack created to support la_pltexit().
The runtime linker cannot detect functions of this type, and thus the audit library creator is responsible for disabling la_pltexit() for such routines.
Runtime Linker Debugger Interface
The runtime linker performs many operations including the mapping of objects into memory and the binding of symbols. Debugging programs often need to access information that describes these runtime linker operations as part of analyzing an application. These debugging programs run as a separate process to the application they are analyzing.
This section describes the rtld-debugger interface for monitoring and modifying a dynamically linked application from another process. The architecture of this interface follows the model used in libthread_db(3THR).
When using the rtld-debugger interface, at least two processes are involved:
One or more target processes. The target processes must be dynamically linked and use the runtime linker /usr/lib/ld.so.1 for 32-bit processes, or /usr/lib/64/ld.so.1 for 64-bit processes.
A controlling process links with the rtld-debugger interface library and uses it to inspect the dynamic aspects of the target processes. A 64-bit controlling process can debug both 64-bit and 32-bit targets. However, a 32-bit controlling process is limited to 32-bit targets.
The most anticipated use of the rtld-debugger interface is when the controlling process is a debugger and its target is a dynamic executable.
The rtld-debugger interface enables the following activities with a target process:
Initial rendezvous with the runtime linker.
Notification of the loading and unloading of dynamic objects.
Retrieval of information regarding any loaded objects.
Stepping over procedure linkage table entries.
Enabling object padding.
Interaction Between Controlling and Target Process
To be able to inspect and manipulate a target process, the rtld-debugger interface employs an exported interface, an imported interface, and agents for communicating between these interfaces.
The controlling process is linked with the rtld-debugger interface provided by librtld_db.so.1, and makes requests of the interface exported from this library. This interface is defined in /usr/include/rtld_db.h. In turn, librtld_db.so.1 makes requests of the interface imported from the controlling process. This interaction allows the rtld-debugger interface to:
Look up symbols in a target process.
Read and write memory in the target process.
The imported interface consists of a number of proc_service routines that most debuggers already employ to analyze processes. These routines are described in "Debugger Import Interface".
The rtld-debugger interface assumes that the process being analyzed is stopped when requests are made of the rtld-debugger interface. If this halt does not occur, data structures within the runtime linker of the target process might not be in a consistent state for examination.
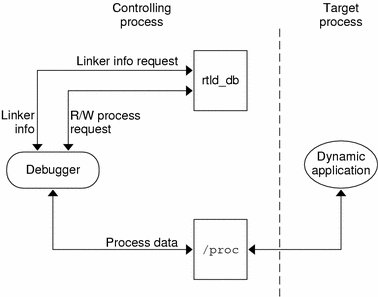
The flow of information between librtld_db.so.1, the controlling process (debugger) and the target process (dynamic executable) is diagrammed in the following figure.
Figure 6-1 rtld-debugger Information Flow

Note - The rtld-debugger interface is dependent upon the proc_service interface, /usr/include/proc_service.h, which is considered experimental. The rtld-debugger interface might have to track changes in the proc_service interface as it evolves.
A sample implementation of a controlling process that uses the rtld-debugger interface is provided in the SUNWosdem package under /usr/demo/librtld_db. This debugger, rdb, provides an example of using the proc_service imported interface, and shows the required calling sequence for all librtld_db.so.1 exported interfaces. The following sections describe the rtld-debugger interfaces. More detailed information can be obtained by examining the sample debugger.


